Become a Job-Ready Data Analyst with Power BI, SQL, Python, Snowflake & Microsoft Fabric — then go beyond the job market with AI Integration: connecting n8n, Make & Claude to your analytics stack.
Start your career in Pakistan's hottest field
Add analytics + AI to your toolkit
Move into data from any background
Sell dashboards & analytics globally
Start your career in Pakistan's hottest field
Add analytics + AI to your toolkit
Move into data from any background
Sell dashboards & analytics globally
The complete modern data analyst stack from spreadsheets to cloud warehouses — taught hands-on with real business datasets of 5M+ records.
Business Intelligence
Database
Database
Enterprise Database
Cloud Data Warehouse
Programming for Data
Data Analysis
Data Visualization
Statistical Charts
The Analyst's Ancestor
Modern Data Platform
AI Automation
AI Automation
AI Assistant
75 hours of Live Training over 3 Months. Full Detailed Curriculum available on request.
Functions, Charts, Pivot Tables & Scenario Analysis
MySQL, PostgreSQL & SQL Server — Queries, Filtering & Functions
Joins, Subqueries, Views & Window Functions
Transformations, Star Schema & Relationships
Calculated Columns, Measures, CALCULATE & Time Intelligence
Visualization, Interactivity, Smart Narratives & Key Influencers
Pandas, Matplotlib & Seaborn on Real Datasets
Modern Cloud Analytics at Enterprise Scale
OneLake, Lakehouse & End-to-End Analytics
Automating Reports, Insights & Data Workflows with AI
Work across Retail, FMCG, Hospitality, Banking, Real Estate & Pharma — on datasets with 5M+ records that mirror real company challenges.
Swipe to explore the projects →
Sales & inventory dashboard — daily sales, stock levels & store-wise profitability.
Marketing campaign performance, customer segmentation, conversion & ROI analysis.
Revenue, popular menu items, customer feedback & peak-hour insights.
Branch-wise performance, top products & customer trends dashboard.
Best-selling categories, store performance & purchasing behavior analysis.
Revenue trends, category performance, regional sales & inventory status.
Order volume, delivery times, ratings & city-wise performance tracking.
Occupancy, revenue per room, booking trends & guest satisfaction.
Property sales analysis & market trends — guided walkthrough project.
P&L dashboarding and financial reporting in Power BI.
Two unguided projects to test your skills on banking & pharma datasets.
The flagship project of Cohort-20: tackle real industry-level issues for 365 Corporation end-to-end — from raw multi-source data to executive dashboards with AI-automated reporting. Built to be the centerpiece of your portfolio and the story you tell in job interviews.
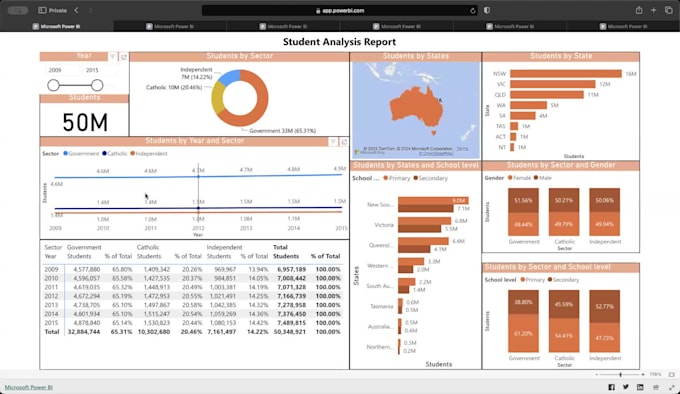
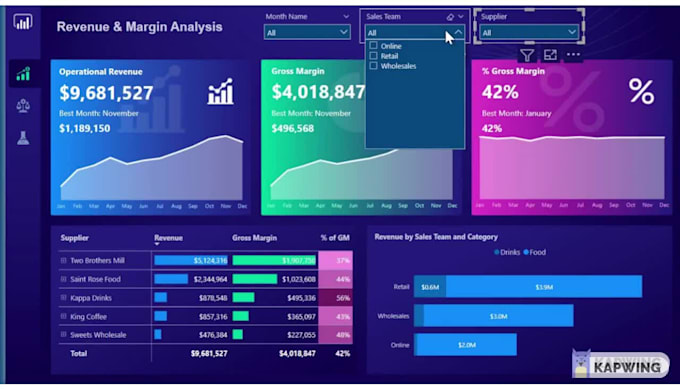
Real, live Power BI gigs on Fiverr — the same dashboards, DAX and Power Query skills you'll master in this course.


Live gigs on Fiverr.com as of June 2026 · Prices shown are sellers' basic packages · PKR estimates at market rates · Earnings depend on your effort, quality & consistency
We believe in committed learners. Finish Cohort-20 successfully and we refund your entire course fee — that's how confident we are you'll stay till the end and walk away job-ready.
"This data analytics course exceeded my expectations with its well-structured content. Sir Abbas's ability to simplify difficult analytical concepts and explain real-world applications made learning valuable and enjoyable."
"One of the best teachers who connected industry and academics — bridging the gap students face in getting jobs that universities don't teach. I learnt many formulas, techniques and industry-wide specifics."
"Both the instructor and course literally improved my knowledge for real time. I gained real experience from projects, and the instructor is very efficient in delivering his education."
"All the teachers were amazing, including Sir Ikram and Sir Abbas. My Excel skills were intermediate, but after this course they improved a lot — and I also learned Power BI and SQL work I can now complete on my own."
"I recently completed the Data Analytics course from Analytics Camp, and overall it was a very valuable learning experience. The biggest strength of this course was definitely the teaching style of Sir Abbas. His teaching method was outstanding from start to finish. Whether it was Excel or Power BI, he explained every concept step by step in a very deep and practical way. He made even difficult topics easy to understand, and I personally learned a lot because of his detailed explanations and supportive attitude. Honestly, Sir Abbas deserves 100/100 for his effort, dedication, and teaching quality. "
"It has been one of the most valuable learning experiences for me. The course was designed in a very organized and practical way, covering all the key areas of data analytics including Excel, SQL, Power BI, Python, data cleaning, and visualization techniques. One of the best parts of this course was the instructor’s exceptional teaching style. The instructor explained every concept with great clarity, patience, and professionalism, making even challenging topics feel simple and approachable. I’m truly grateful to the instructors, Sir Abbas, Sir Ikram, Sir Anas and Sir Nofil for providing such quality learning. I would recommend this course to anyone interested in data analytics, whether you are a beginner or someone looking to upgrade your skills."
Fill the form below and our team will reach you on WhatsApp.